

Most sports organizations finish a season with a folder of registration numbers and a general sense of how things went. Far fewer finish a season with a clear, evidence-based picture of where participants actually ended up, which levels are working, which are not, and where the coaching pipeline is thinning out. That gap is not a data problem. It is a planning problem, because every one of those answers already exists inside the evaluations that coaches recorded throughout the year. The organizations that review it properly walk into next season’s planning with a real map. The ones that do not are guessing again.
To show what this actually looks like in practice, we pulled a real, anonymized three-year participant dataset from an organization using Checklick’s evaluation platform and walked through what the numbers reveal. Nothing below is hypothetical. It is what shows up when a national-level sport organization actually looks at its own evaluation history. See how Checklick’s evaluation platform captures this data automatically
Seasonal Data Shows You When Your Program Actually Runs
The first thing a full-year participation chart exposes is how concentrated your season really is. In this organization’s data, monthly participation stayed close to zero for most of the year and then spiked dramatically across two consecutive months, accounting for the overwhelming majority of all annual activity before dropping back to near zero.
That is a useful number precisely because most program planning happens as if activity were spread more evenly across the year. If two months carry almost the entire season, then staffing, evaluator scheduling, and communication timing should be built around that reality, not around a generic 12-month calendar. Organizations that plan hiring, training, and marketing pushes around when families are actually engaged, rather than around the calendar year, get more out of the same season.
Level-by-Level Numbers Show Exactly Where the Drop-Off Happens
Participation by level is where the story gets specific. In this dataset, the entry level accounted for thousands of participants each year, and the very next level up held onto a large share of that group. From there, however, each subsequent level lost a substantial portion of participants, and by the upper levels, annual participation had fallen to a small fraction of where it started, sometimes into the single digits.
A drop-off like that is not automatically a problem. Some attrition between beginner and advanced levels is normal in any skill progression. What matters is whether an organization can see exactly where the steepest drop happens, because that is where a targeted intervention, a clearer next-step communication, a bridge program, a specific coaching push, will have the most impact. Without level-by-level data, that steepest point is invisible. With it, it becomes the first place a program director looks when planning next season.
Retention Data Reveals Which Levels Keep Families Coming Back
The organization’s three-year retention trend, meaning the share of participants evaluated in one year who were evaluated again the following year, varied enormously by level. Some levels retained a large majority of participants year over year. Others saw retention swing sharply, in some cases falling to a small fraction of participants returning the following season before partially recovering.
This is the kind of pattern a single end-of-year summary would never surface, because it only becomes visible when you track the same participants across multiple seasons at the individual level. A level with consistently strong retention is doing something right that is worth understanding and replicating. A level with retention that collapses in a specific year is a flag worth investigating before assuming next season will look the same.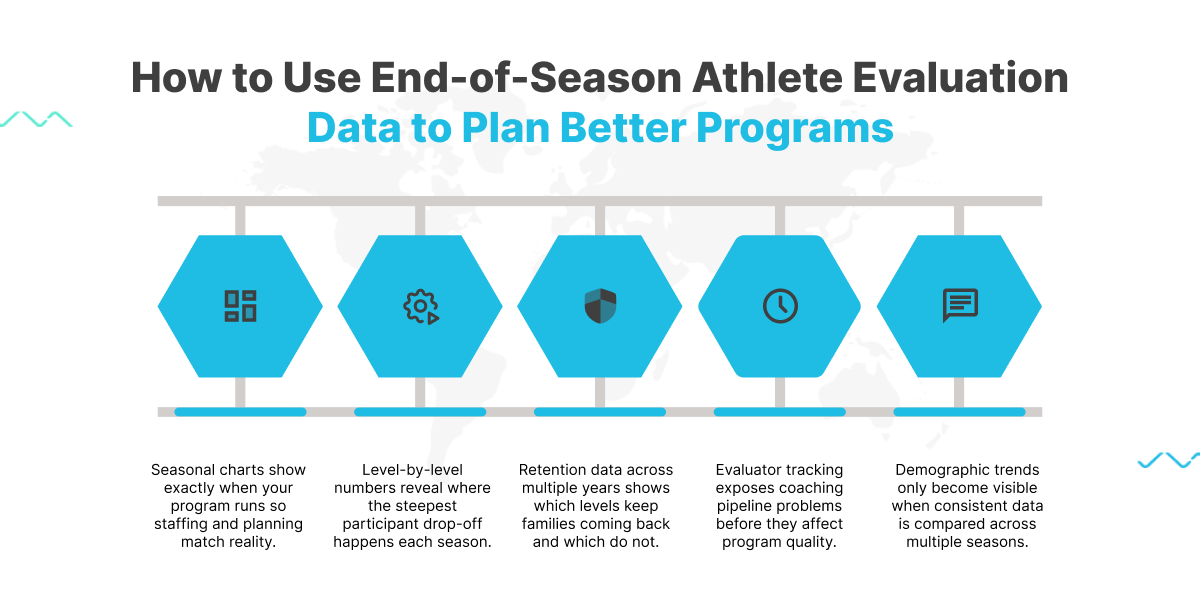
Evaluator Data Shows a Pipeline Problem Most Organizations Never Track
One of the more revealing charts in this dataset was not about participants at all. It tracked evaluators, the coaches and instructors actually running assessments, across three years, splitting them into new, returning, and inactive.
The total evaluator pool grew each year. At the same time, the number of evaluators who went inactive each year also grew steadily, and the number of returning evaluators as a share of the total shrank. In other words, the organization was replacing its evaluator base with new people faster than it was retaining the ones it already had trained.
That is a coaching capacity risk that would be very difficult to spot from headline growth numbers alone, since total evaluator counts kept climbing even as retention among trained evaluators quietly weakened. An organization that reviews evaluator-level data, not just participant data, catches problems like coach burnout, unclear advancement paths for instructors, or gaps in ongoing training well before they show up as a service quality issue. See how Checklick’s evaluation platform tracks evaluator activity alongside participant data
Demographic Data Shows Whether Participation Is Actually Representative
Gender distribution across the three years in this dataset stayed fairly stable, with participants who did not specify a gender making up a meaningfully growing share of the total each year while the recorded male-to-female ratio held roughly steady. On its own, that is a small shift. Tracked over multiple seasons, it becomes a data point worth asking questions about, whether it reflects a change in who is registering, a change in how registration forms are completed, or something else entirely.
The point is not that any single year’s demographic snapshot tells a complete story. It is that only by comparing consistent data across seasons can an organization tell whether a pattern is a one-year blip or a real shift worth addressing in outreach and program design.
What This Means for Planning Next Season
None of these insights required a special research project. They came from evaluation data that was already being recorded during normal program delivery, organized and reviewed at the end of the season. The organizations that get the most out of their evaluation systems are not the ones collecting the most data. They are the ones that actually sit down with it once the season ends and ask specific questions: Where did participants drop off? Which levels retain families and which do not? Is the coaching pipeline healthy or thinning? Is participation shifting in ways that deserve a response?
Checklick’s Athlete Development Tracking System captures this data automatically as evaluators record progress throughout the season, and generates participant reports that surface exactly these patterns, without requiring a manual data project at year end. See how Checklick’s Evaluation Marketplace supports program tracking at scale
Frequently Asked Questions
What is end-of-season athlete evaluation data used for?
End-of-season evaluation data shows where participants ended up developmentally, which levels retained the most families, how the coaching or evaluator base changed over time, and where participation is concentrated or dropping off. Reviewed together, these patterns inform staffing, program design, and retention strategy for the following season.
How do you know if a drop-off between levels is a problem?
Compare the drop-off across multiple years and levels rather than looking at a single season in isolation. A consistent, sharp decline at the same level year after year signals a specific point in the pathway worth investigating. Normal, gradual attrition across an entire progression is expected and not automatically a concern.
Why should organizations track evaluator or coach retention, not just participant retention?
Growing participant numbers can mask a shrinking base of experienced coaches if the organization is replacing evaluators faster than it retains them. Tracking evaluator retention separately from participant retention surfaces coaching capacity risks before they affect program quality.
How often should a sports organization review its evaluation data?
At minimum, once per season, immediately after the primary program window closes, while the data is complete and still relevant to planning decisions for the next cycle. Organizations tracking multi-year trends should also review year-over-year comparisons, not just single-season snapshots.
Start your free trial at checklick.com and see what your own evaluation data reveals about your program.